Data Studio
I have been using Google’s Data Studio since 2016 when I was invited to test the new Data Visualization tool, and it was very buggy at first. Since then, it has evolved into a very powerful DMP.
- I believe in telling impactful stories. These stories always have a more significant impact when the visualization of these reports is engaging. Hence, the data is more easily understood and retained and, most significantly, used to improve and optimize current campaigns.
- I believe in empowering teams with real-time data on campaign performance and Visitor metrics used to target prospective customers. So I create a report with geo, age, sex, highest-performing Keywords, etc., used by the client or agency to find the highest quality traffic and optimize Ad spend.
- Unite your data in one place. Transform your raw data into the metrics and dimensions needed to create easy-to-understand reports and dashboards.
- I have also worked connecting many outside data sources either via an API or through Data Sheets.
- Reports are usually sent to the Stakeholder weekly, bi-weekly, or campaign-based reporting. This cadence is different for each Client and each department.
- Some executive dashboards mainly concentrating on site KPIs, including engagement KPIs, Conversion KPIs or Analytic goals, and paid media KPIs are sometime sent our daily
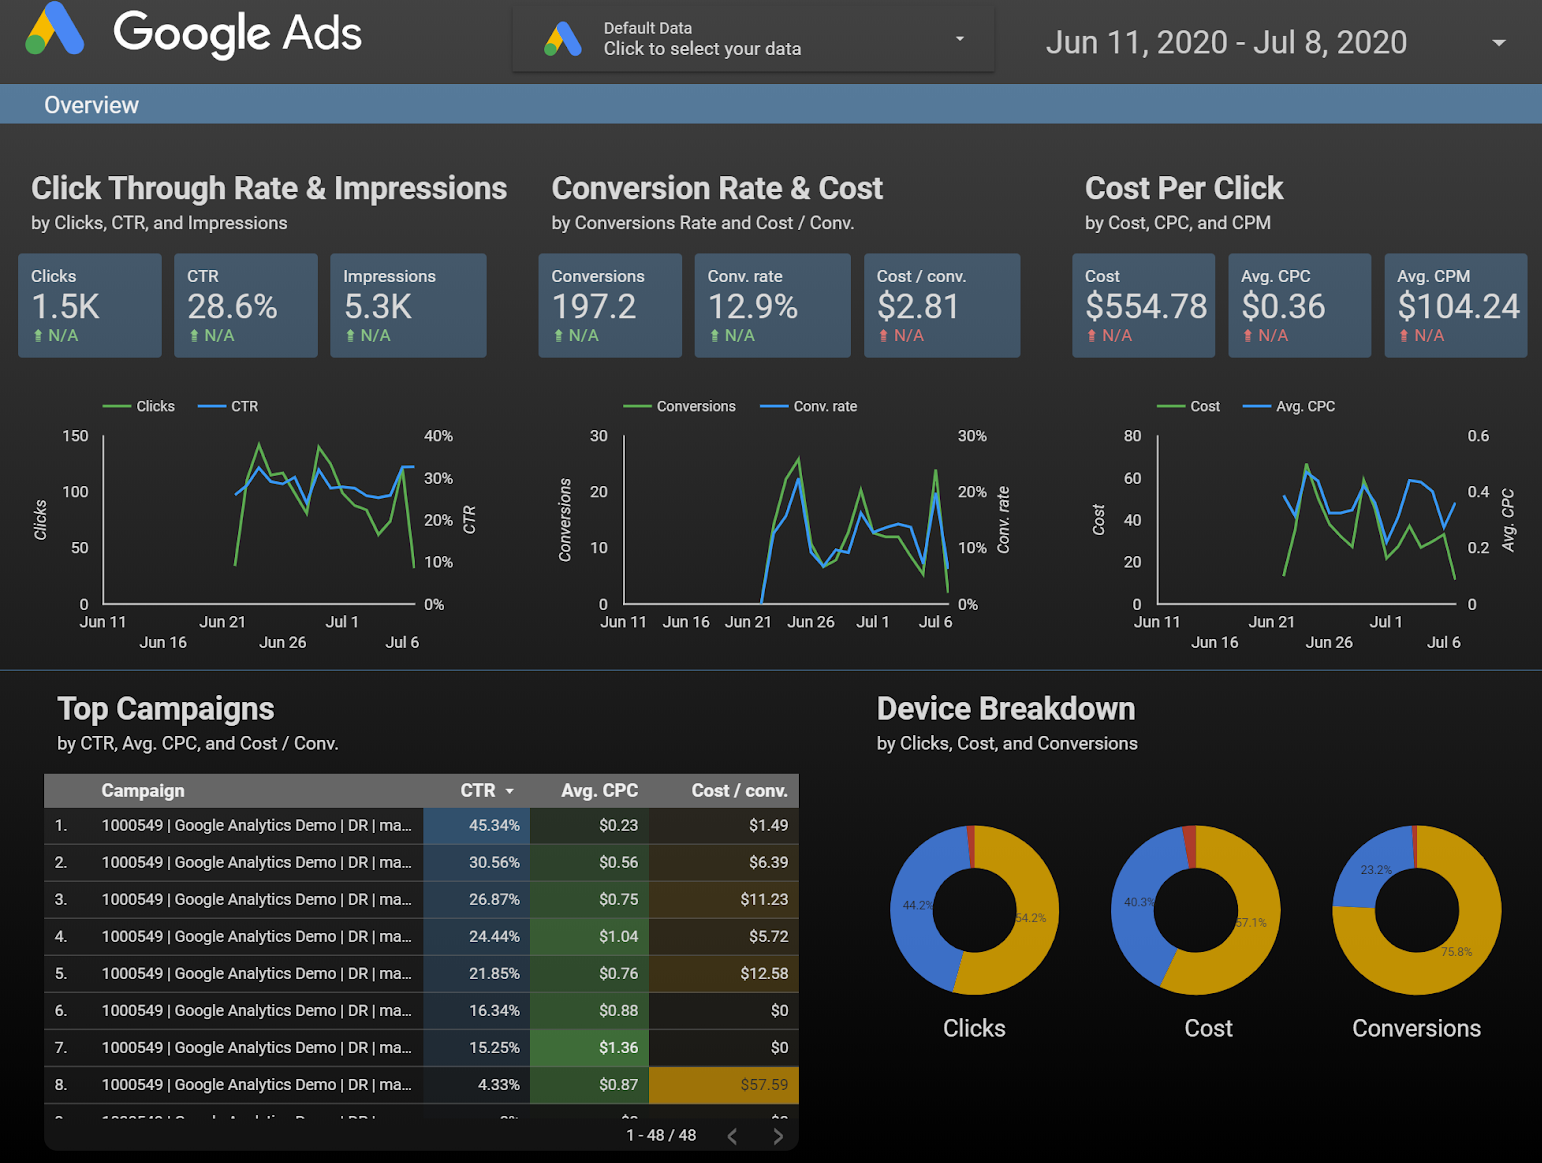
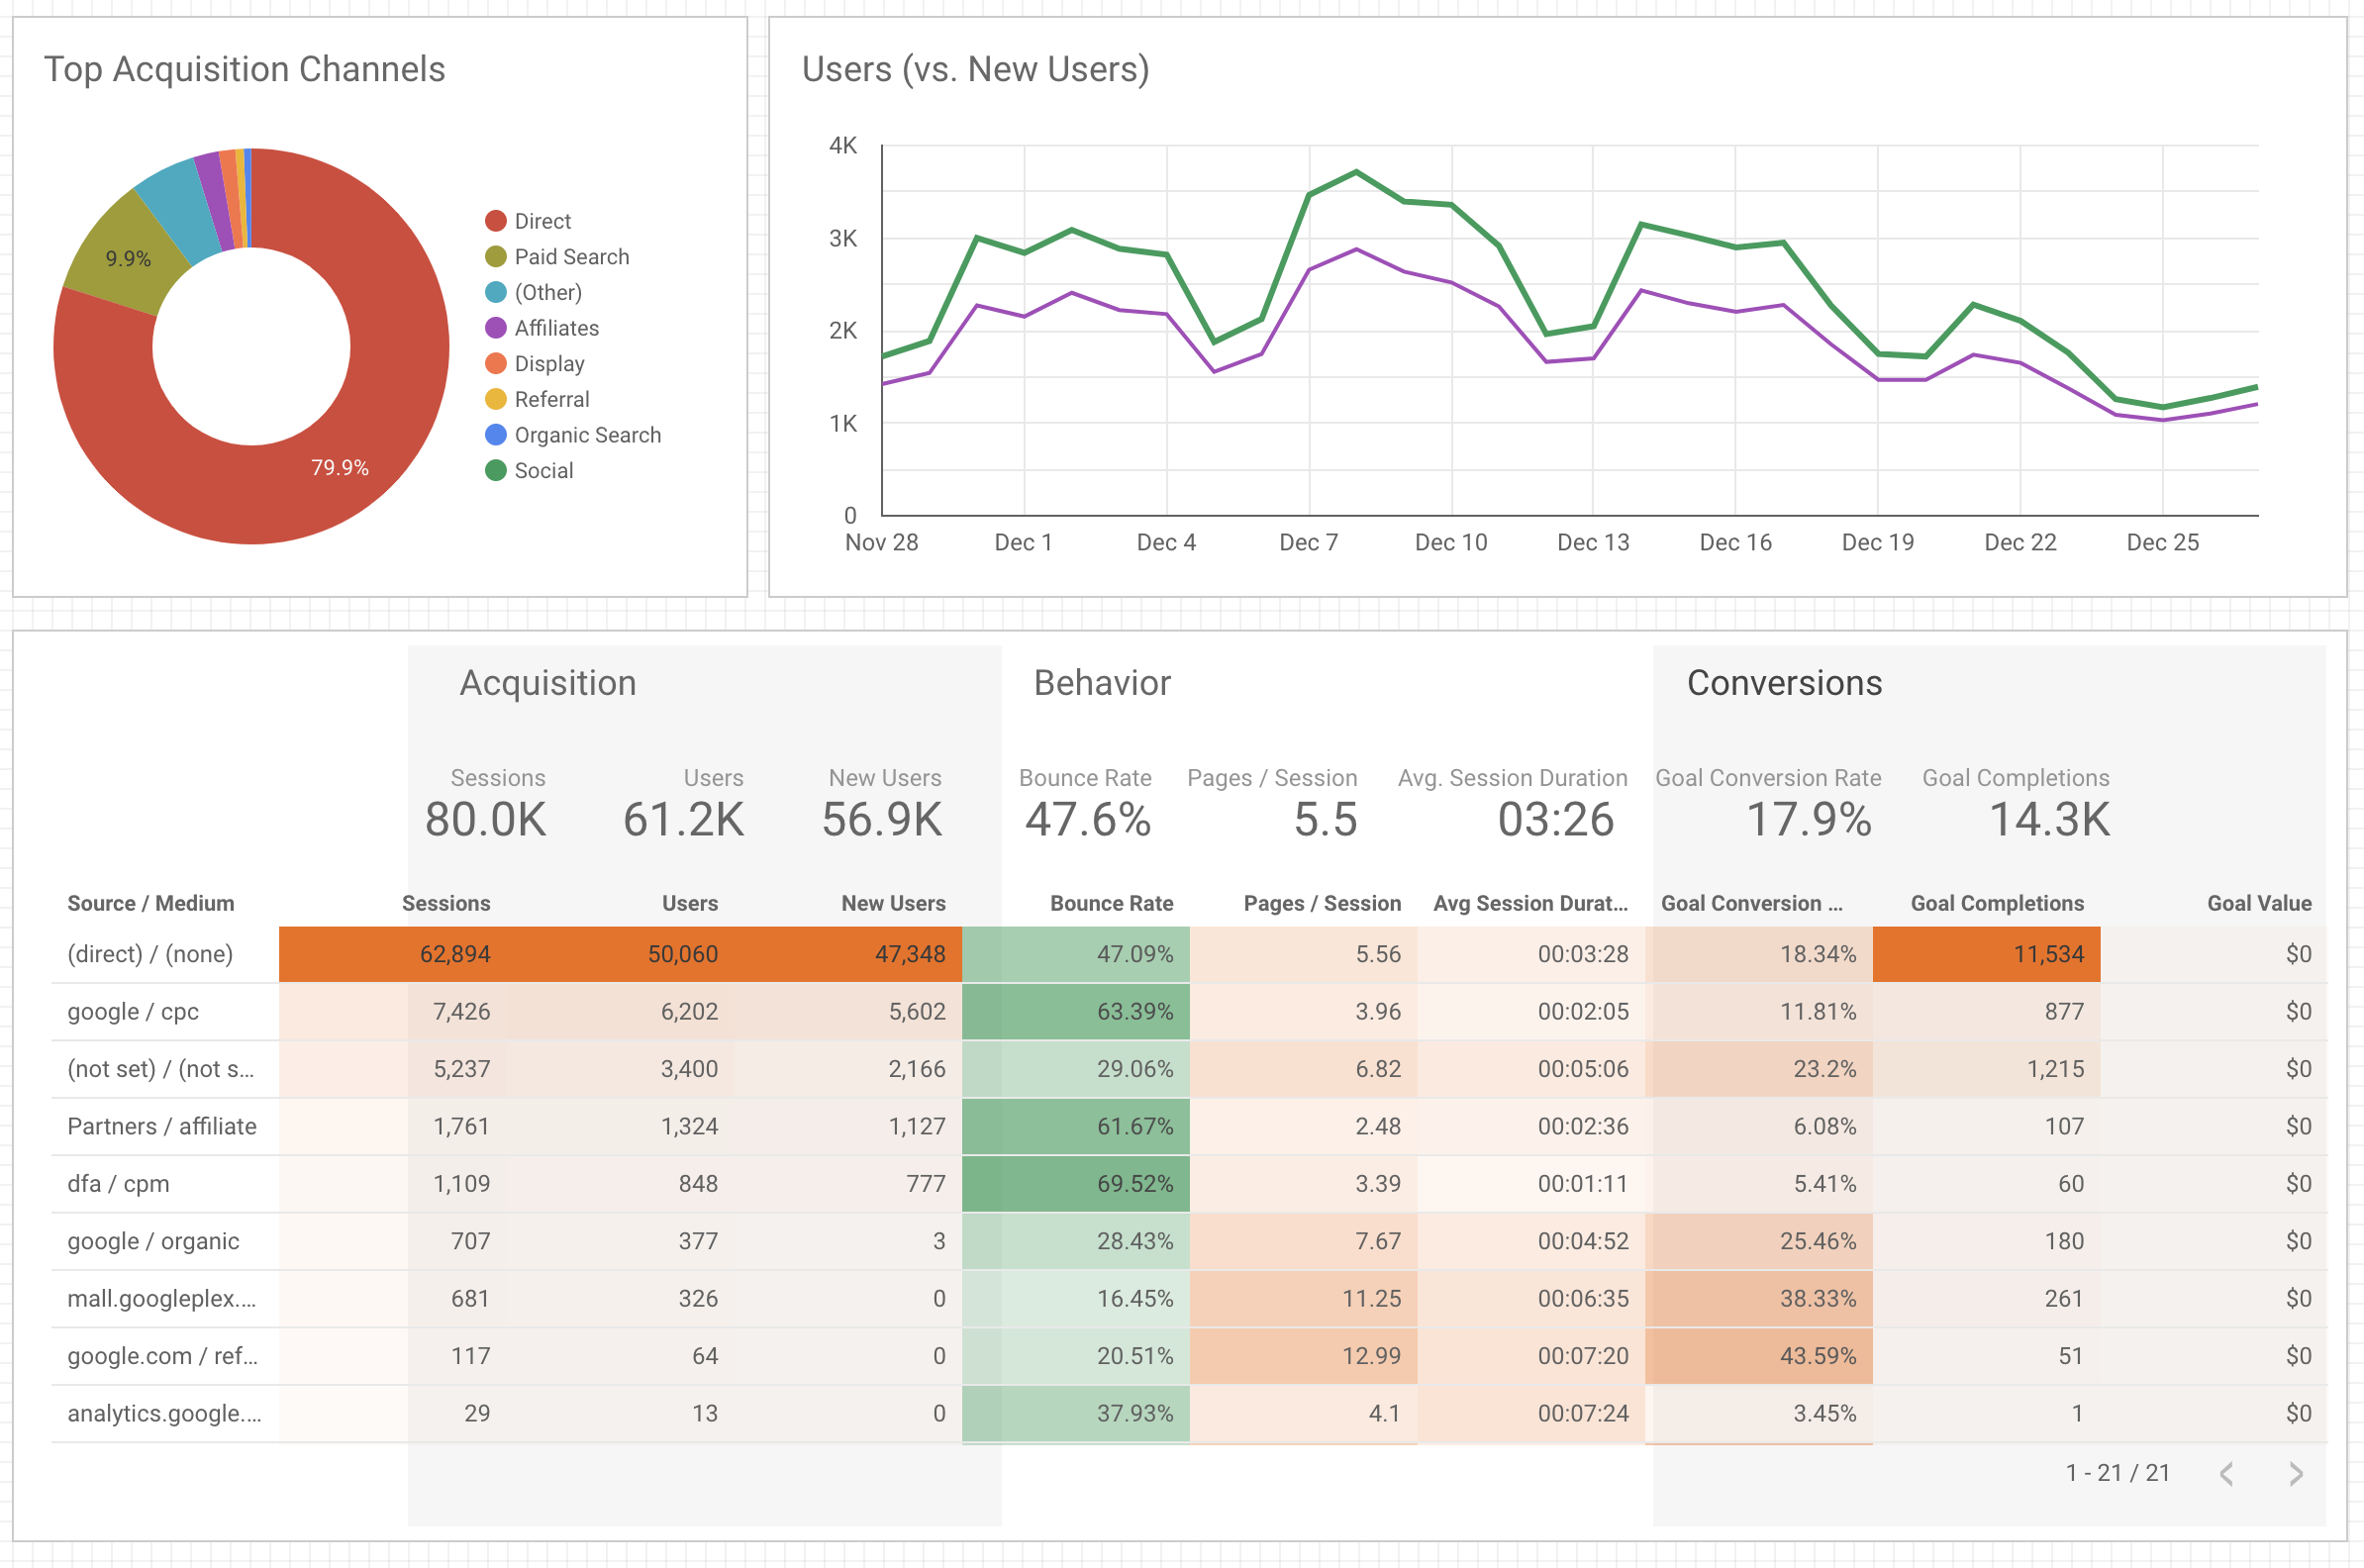
- Data Studio Dashboard that I have created includes too many to count, but for most clients, there are at least three necessary reports – Website Traffic, engagement, and Conversions – Social Media Dashboards with Blended data both from the Social Network married with Website traffic (did they come to the site and do what you wanted them to do), Paid Media Dashboard, these are usually AdWords campaigns with Blended Ad Manager and Website data.
- Other more complex Reports include Campaign Dashboards, E-commerce Dashboards, and SEO Dashboards
My Data Studio Reports experience:
- I have been using Google’s Data Studio since 2016, when I was invited to test the new Data Visualization tool, and it was very buggy at first. Since then, it has evolved into a very powerful DMP.
- I believe in telling impactful stories. These stories always have a more significant impact when the visualization of these reports is engaging. Hence, the data is more easily understood and retained and, most significantly, used to improve and optimize current campaigns.
- I believe in empowering teams with real-time data on campaign performance and Visitor metrics used to target prospective customers. So I create a report with geo, age, sex, highest-performing Keywords, etc., used by the client or agency to find the highest quality traffic and optimize Ad spend.
- Unite your data in one place. Transform your raw data into the metrics and dimensions needed to create easy-to-understand reports and dashboards.
- I have also worked connecting many outside data sources either via an API or through Data Sheets
- Reports are usually sent to the Stakeholder weekly, bi-weekly, or campaign-based reporting. This cadence is different for each Client and each department.
- Some executive dashboards mainly concentrating on site KPIs, including engagement KPIs, Conversion KPIs or Analytic goals, and paid media KPIs are sometime sent our daily
- Data Studio Dashboard that I have created includes too many to count, but for most clients, there are at least three necessary reports – Website Traffic, engagement, and Conversions – Social Media Dashboards with Blended data both from the Social Network married with Website traffic (did they come to the site and do what you wanted them to do), Paid Media Dashboard, these are usually AdWords campaigns with Blended Ad Manager and Website data.
- Other more complex Reports include Campaign Dashboards, E-commerce Dashboards, and SEO Dashboards
Some Reports I have Created
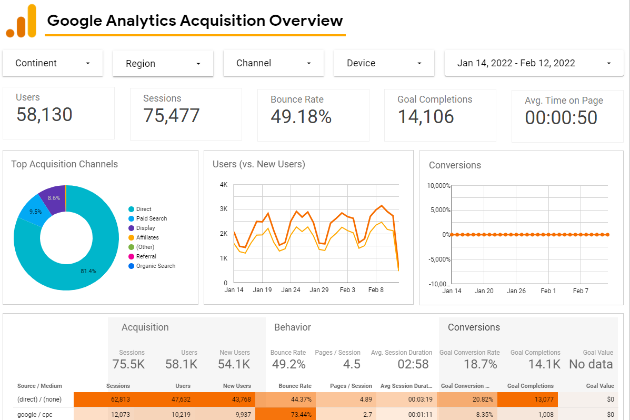
- Advanced Analytics Overview dashboards
- Advanced SEO Dashboards
- Advanced Digital Marketing Dashboard
- Advanced B2B marketing Dashboard
- Advanced eCommerce Funnel Dashboards
- Bing and Google Webmaster Tools Dashboard
- Facebook Ads dashboard
- Google Ad Manager Dashboard
- CRM email campaign reporting Dashboard
- YouTube channel performance Dashboard
API’s I have used to Import Data
- Facebook (Insights and Referral)
- Twitter (Insights and Referral)
- LinkedIn (Insights and Referral)
- Optimizely
- Redditt
- Salesforce
- CRM email campaign reporting Dashboard
- YouTube (Insights and Referral)
- Search Console
- HubSpot
- MailChimp
- SEMrush
- Bing
- WebMaster Tools
- BrightEdge
- YouTube channel performance Dashboard
- Advanced Analytics Overview dashboards
- Advanced SEO Dashboards
- Advanced Digital Marketing Dashboard
- Advanced B2B Marketing Dashboard
- Advanced eCommerce Funnel Dashboards
- Bing and Google Webmaster Tools Dashboard
- Facebook Ads dashboard
- Google Ad Manager Dashboard